Data Analysis
For the data analysis and summary, scores were labeled on the scale of “advanced, proficient, proficient-, progressing, and beginning” based on the district grading scale. Percentages are as follows: 90%-100% is advanced, 80%-89% is proficient, 70-79% is proficient-, 60-69% is progressing, and 0-60% is beginning.
Phonics Assessment
Pre-test data showed that 14 students were advanced (90%-100% accuracy) in their overall phonics score, and 9 were proficient (80%-88% accuracy). Post-test data showed that 18 students were advanced and 5 were proficient. The phonics test was broken into two subsections: letter identification and sound production.
For letter-identification, the 2 students who scored at proficient increased to advanced while two other students decreased from advanced to proficient.
Student “A” received a 92% on the pre-test and an 84% on the post-test. Looking at this students data, I realized some of her data was not consistent. On the pre-test, Student “A” did not identify the letters “l” and “q” correctly. On the post-test, student “A” did not identify “d,” “b,” “y,” or “q.” The only consistently missed letter was letter “q.” On the pre-test, student “A” was able to identify the other three letters.
Student “B” received 92% on the pre-test and an 88% on the post-test. On the pre-test, student “B” did not identify the letters “u” and “q.” On the post-test, she did not identify “b,” “j,” or “q.” Similarly to student “A,” the only consistently missed letter was letter “q.”
- Letter Identification: Pre-test data showed that out of 23 students, 21 were advanced in the area of letter identification (92%-100% accuracy) and 2 students were proficient (80%-88% accuracy). Post-test data showed that 21 were advanced in the area of letter identification and 2 were proficient, however, the two students that were performing below advanced increased in the post-test. In the post-test, two students decreased in scores from advanced to proficient.
For letter-identification, the 2 students who scored at proficient increased to advanced while two other students decreased from advanced to proficient.
Student “A” received a 92% on the pre-test and an 84% on the post-test. Looking at this students data, I realized some of her data was not consistent. On the pre-test, Student “A” did not identify the letters “l” and “q” correctly. On the post-test, student “A” did not identify “d,” “b,” “y,” or “q.” The only consistently missed letter was letter “q.” On the pre-test, student “A” was able to identify the other three letters.
Student “B” received 92% on the pre-test and an 88% on the post-test. On the pre-test, student “B” did not identify the letters “u” and “q.” On the post-test, she did not identify “b,” “j,” or “q.” Similarly to student “A,” the only consistently missed letter was letter “q.”
- Sound Production: Pre-test data showed that 11 were advanced in the area of letter-sounds (92%-100% accuracy), 7 were proficient (80%-88% accuracy), and 5 were proficient- (76% accuracy). Post-test data showed that 15 students were advanced in the area of letter sounds, 6 were proficient, and 2 were proficient-. While not all students were performing at advanced, all students that had originally been placed at proficient or proficient- had increased their scores except for one student, who received the same score of proficient on the post-test. See Figure 1 below.
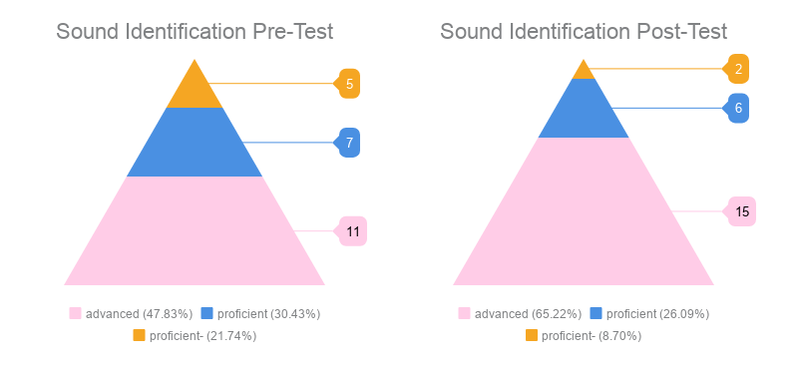
Figure 1: This graph shows the amount of advanced, proficient, and proficient- scores on the sound identification portion of the phonics pre- and post-tests. As the post-test graph shows, the advanced scores increased and the proficient- scores decreased. As a class, my students increased in their knowledge of letter sounds.
Further examination of the data showed the most common misconceptions or misunderstandings. In both pre- and post-tests, the most missed sounds were letters Q, U, E, and Y. In the pre-test the most missed letter was “Y” with 10 students missing that sound. In the post-test, this drastically decreased to 3 students. Letters “Q” and “E” greatly decreased, while letter “U” only decreased by 1 student. See Figure 2 below.

Figure 2: This graph shows the number of students that missed the sounds for the letters Y, Q, U, and E on the phonics pre- and post-tests. The amount of students that missed each letter decreased in the post-test, but the letter U only decreased by one student, suggesting that the /u/ sound needs more instruction.
|
Due to the high number of errors in the post-test, the data shows that the letter “U” needed more instruction. Some students mistook the /u/ sound for the /y/ sound, and this was a common error before and after research. In order to prevent this confusion, students may need an explicit lesson where students sort words with the /u/ and /y/ sounds in order to cement that the sounds are different and correspond to different letters. While Q, E, and Y also decreased in the post-test, they were still the most common errors before and after research. This showed that my students may need more exposure to the letters Q and Y. Typically, these letters are hardly present in the books they are reading, and are much less common than other letters. Also, the /q/ sound is a blend of sounds that produce the /kwa/ sounds. Some students may need clarification on the true sound for the letter Q. Lastly, the /e/ sound was often confused with the /i/ sound. As mentioned above the Q and Y, students may need further intervention and practice sorting pictures based on the two different sounds.
|
Phonemic Assessment
Pre-test data showed that 16 students were advanced in overall phonemic awareness (92%-100% accuracy), 3 were proficient (84%-86% accuracy), 2 were proficient- (71%-78% accuracy), and 2 were beginning (39%-57% accuracy). Post-test data showed that 21 were advanced (92%-100% accuracy) and 2 were proficient (82%-87% accuracy). See Figure 3 below for a breakdown of the overall phonemic awareness scores.
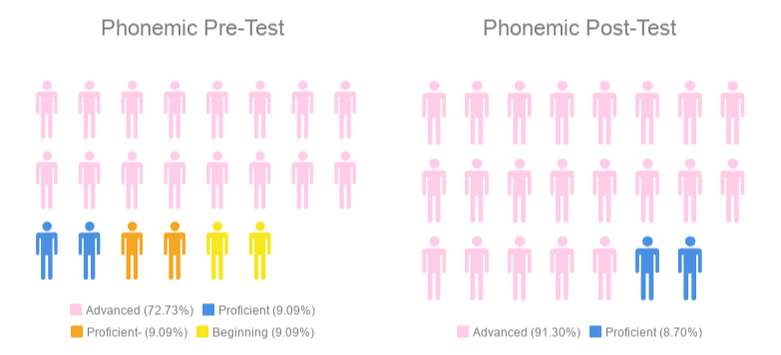
Figure 3: This graph shows the amount of students who received advanced, proficient, proficient- and beginning scores in the phonemic pre- and post-tests. These scores include all subsections: initial sounds, final sounds, blending sounds, and segmenting sounds. The post-test graph shows that the entire class was proficient or advanced in the area of phonemic awareness.
This test was broken down into 4 subsections: initial sounds, final sounds, blending sounds, and segmenting sounds. All four subsections showed an increase in the number of advanced scores.
- Initial Sounds: Pre-test data showed that 21 students were advanced and 2 were proficient. This increased in the post-test to all 23 students being advanced.
- Final Sounds: Pre-test data showed that 12 students were advanced, 5 were proficient, 5 were progressing, and 1 was beginning. This was the lowest scoring subsection on the phonemic test, but this increased in the post-test to 20 students being advanced and 3 being proficient. See Figure 4 below and the phonemic subsections for further explanation.
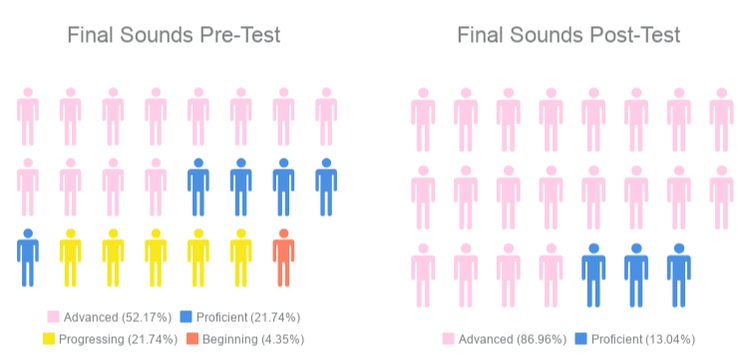
Figure 4: This graph shows the number of students who received advanced, proficient, progressing, and beginning scores on the final sounds pre- and post-tests. The amount of advanced scores increased in the post-test, and all 23 students scored proficient or advanced in the post-test showing an increase in understanding.
- Blending: Pre-test data showed that 18 were advanced, 1 was proficient, 1 was progressing, and 1 was beginning. This increased in the post-test to 20 students being advanced, 2 being proficient, and 1 being proficient-.
- Segmenting: Pre-test data showed that 18 students were advanced, 2 were proficient, and 3 were beginning. This increased in the post-test to 21 students being advanced, 1 being proficient, and 1 being proficient-.
Phonemic Subsections
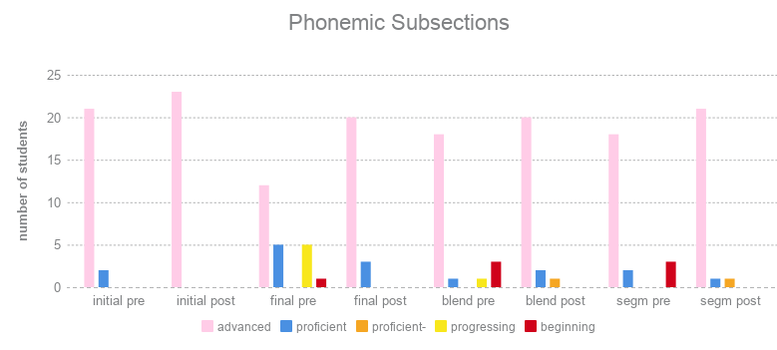
Figure 5: This graph shows each subsection of the phonemic awareness test and the class scores for each pre- and post-test. Each subsection showed a growth in advanced and proficient scores. There were no progressing or beginning scores in the post-tests, showing that students had increased their understanding of initial sounds, final sounds, blending, and segmenting.
Based on the data from each subsection, growth was made in each section, as noted by the growth in the “advanced” columns in each section. No section showed a decrease in scores as an entire class. See Figure 5 above.
The data indicated that my class had a well-rounded understanding of initial sounds before research occurred. However, this was not reflected in the final sounds subsection, which was the lowest scoring subsection. While the entire class was performing at proficient or advanced in initial sounds in the pre-test, final sounds was less understood. I noted that students could easily identify the sounds at beginning of words, but struggled more with sounds at the end of the words. After research, the final sounds subsection showed the most growth as indicated by the increased number of advanced and proficient scores.
The final sounds assessment included five words: dog, rope, hive, bat, and tree, the final sounds being /g/, /p/, /v/, /t/, and /ee/. The word "tree" caused some confusion with some of my students, since they were not used to identifying the final sound as a vowel. This may have impacted the scores due to this particular word. With only five questions, missing one meant the difference between an advanced score or a proficient score, etc.
Yhe initial sounds section also only had five words, the words used on the initial sounds portion (duck, spoon, fish, leaf, heart) all began with consonants. The final sounds portion included vowels as ending sounds, the initial sound portion did not. This may be another reason why the initial sounds scores were much higher than the final sounds scores.
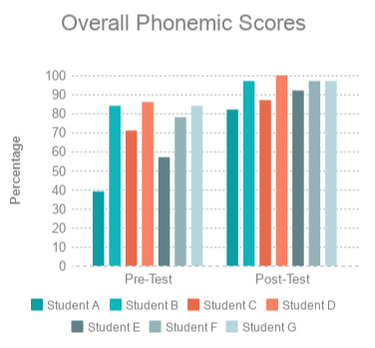
Figure 6: This graph displays 7 students who showed significant growth in phonemic awareness. All students were proficient or advanced in the post-test.
|
Specific students showed significant growth in phonemic awareness. All 7 students who were not advanced on the phonemic awareness pre-test increased. See Figure 6 to the left.
One student who received an overall phonemic score of beginning increased to an overall score of advanced, and another student who had an overall phonemic score of beginning increased to an overall score of proficient. Two students who received an overall score of proficient- increased to advanced or proficient. Three students who received an overall score of proficient increased to advanced. |
Phonological Awareness Assessment
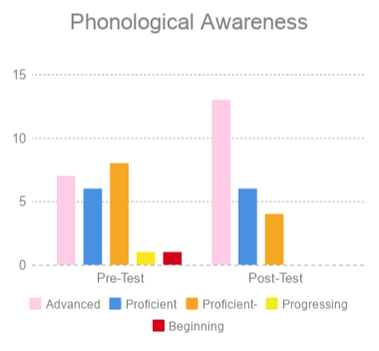
Figure 8: This graph displays the amount of students who scored advanced, proficient, proficient-, progressing, and beginning on the phonological awareness test. Scores improved in the post-test as seen by the increased number of advanced scores and a decrease in proficient-, progressing, and beginning scores.
Pre-test data showed that 7 students were advanced in overall phonological awareness (90%-100% accuracy), 6 were proficient (80%-86% accuracy), 8 were proficient- (70-76% accuracy), 1 was progressing (66% accuracy), and 1 was beginning (56% accuracy). The phonological awareness test was the lowest performing word study test. Post-test data showed an increase; 13 students were advanced, 6 were proficient, and 4 were proficient-.This test was broken into three subsections: word awareness, syllables, and rhyming. See Figure 8 above.
- Word Awareness: Pre-test data showed 19 students were advanced, 3 were proficient, and 1 was progressing. Post-test data showed that all 23 students were advanced.
- Syllables: Pre-test data showed that 5 students were advanced, 3 were proficient, 5 were progressing, and 10 were beginning. Post-test data showed that 11 were advanced, 2 were proficient, 3 were progressing, and 7 were beginning. While 16 students increased their scores or remained the same at advanced, 6 students decreased their score on the post-test and one remained the same. This shows that this section of the phonological awareness test was the lowest performing section in both the pre- and post-tests. See Figure 9 below.
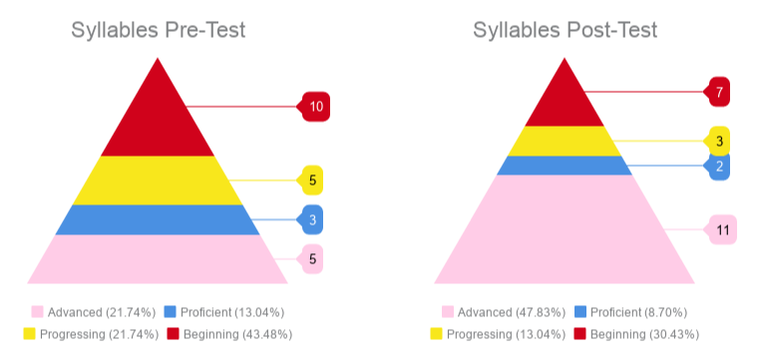
Figure 9: This graph shows a breakdown of the syllables subsection of the phonological awareness test. The number of advanced scores increased in the post-test, and while beginning scores decreased, it was still a considerable amount of students performing below the goal of proficient. Syllables was the lowest performing subsection in both pre- and post-tests.
It’s important to note that the syllables portion of the test only had 6 questions. Missing 1 more more question would mean the difference between advanced and proficient, etc. This is the only subsection of the phonological test (and other tests) that showed the least amount of growth and had a substantial number of students decrease in the post-test.
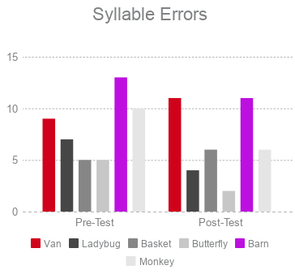 Figure 9: This graph shows the amount of students that missed certain words on the syllables test. Out of 6 words, the 2 most missed were "van" and "barn" on both the pre- and post-test. This data shows that students needed more exposure and practice with monosyllabic words.
Based on this information, syllables was something that some of my students struggled with before and after research. There were 6 words: two had three syllables (butterfly and ladybug), two had two syllables (monkey and basket), and two had one syllable (barn and van). The most common mistake made was in regards to monosyllabic words (van and barn). Students would often break this up into chunks in regards to phonemes, rather than syllables (/b/ /ar/ /n/ and state it was 3 syllables.)
Of all errors made in the syllables pre-test (49 total), the two most frequent errors were monosyllabic words. Of all errors on the syllables post-test (42 total) the two most frequent errors were also monosyllabic words. Single syllable words were misunderstood before and after research, therefore further intervention is necessary in order to close the gap. See Figure 9 to the right.
Of all errors made in the syllables pre-test (49 total), the two most frequent errors were monosyllabic words. Of all errors on the syllables post-test (42 total) the two most frequent errors were also monosyllabic words. Single syllable words were misunderstood before and after research, therefore further intervention is necessary in order to close the gap. See Figure 9 to the right.
- Rhyming: Pre-test data showed that 11 were advanced, 6 were proficient, 2 were proficient-, and 4 were beginning. Post-test data showed 18 students were advanced, 4 were proficient, and 1 was beginning. All 23 students increased or remained at advanced; while one student remained in the beginning range, they increased from 14%-43%. One student increased from proficient- to proficient, and two students increased from beginning to proficient.
Phonological Subsections
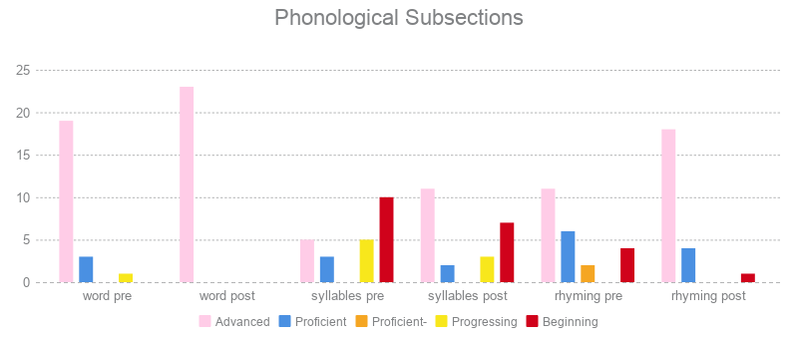
Figure 10: This graph displays the scores from each subsection of the phonological awareness test. While all sections showed an increase in advanced and/or proficient scores, the syllables section was still significantly lower than other subsections.
Based on the data from each subsection, growth was made in each section as a class. In this graph you can see that tests showed an increase in the advanced and proficient scores. Word awareness post-test increased to all advanced scores. The syllables subsection showed an increase in advanced scores and a decrease in progressing and beginning. While this was growth, there was still a substantial amount of beginning scores when compared to the other subsections; word study had no beginning scores in the post-test and rhyming had 1. Rhyming also showed an increase in advanced scores. The amount of proficient- went from 2 to 0, and the 4 beginning scores decreased to only 1 beginning score. See Figure 10 above.
Based on this information, it’s clear that syllables was the section that showed the least improvement and needed further practice in the classroom. I could tell that my class, as a whole, held a solid understanding of word awareness and rhyming. Further practice may be needed for specific students, such as the one student who scored beginning on the rhyming post-test.
Based on this information, it’s clear that syllables was the section that showed the least improvement and needed further practice in the classroom. I could tell that my class, as a whole, held a solid understanding of word awareness and rhyming. Further practice may be needed for specific students, such as the one student who scored beginning on the rhyming post-test.
Fountas and Pinnell Benchmarking Assessment
Prior to research, only 8 of my students were reading on grade level (C or higher). 2 students were considered “non-readers” or a “Pre-A.” 6 students were reading at a level “A,” and 7 students were reading at a level “B.” After research, 16 students were reading on grade level (C or higher). The remaining 7 students were not on grade level, but 4 had made an increase of 1-2 levels, and 3 students remained at the same level. Lastly, two students did not increase in the post-test because they were reading at a level E and I was not able to assess them past that level. See Figure 11 below.
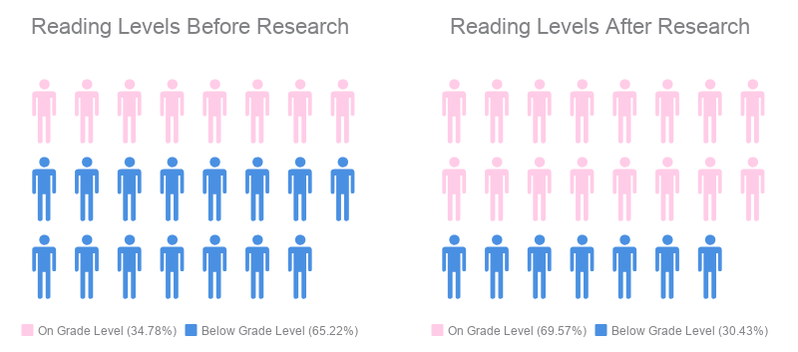
Figure 11: This graph shows the number of students who were reading on grade-level and below grade-level before and after research. Students reading on grade-level were reading "C" level books or higher. Students reading below grade-level were reading "B" leveled books or lower (Pre-A, A, and B).
A total of 14 students increased in reading level (some were on grade-level before research and increased, others were below grade-level and increased). Nine students increased one level, 3 students increased 2 levels, one student increased 3 levels and one student increased 4 levels. See Figure 12 below.
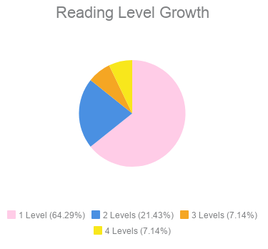
Figure 12: This graph shows a breakdown of the 14 students who increased their reading level. The majority of these students increased 1 reading level, and some students increased 2, 3, or 4 levels.
This shows that the intervention had an impact on many students' reading ability. Data almost flipped in the post-tests; while a majority of students were below grade level in the pre-tests, majority were on grade level, or above, in the post-test. I also had some students that increased more than one level. There are a few reasons that this could have occurred. First, the activities in the study could have greatly impacted those specific students, causing an increase in their phonics, phonemic awareness, and phonological awareness, which in turn caused an increase in reading level.
Second, it could also be said that the pre-test scores were inaccurate. For some students that began at a “Pre-A” or “A,” growth of 1-2 levels is appropriate. For my two students that increased 3 and 4 levels, I wonder if their original scores were inaccurate. An increase in 3-4 scores over 7 weeks is highly impressive, but is not the norm for most kindergarten students. While it could be that the study had a great influence on them and scores increased due to the activities implemented, it could also be that they were reading at a higher level in the beginning but were labeled at a lower level due to the assessment.
For example, a student that started the Fountas and Pinnell assessment reading a level “A” book is only allowed 3 errors for the entire book. If a student makes more than 3 errors, the assessment ends and they are not to continue to a level “B” book.
Perhaps some students made too many errors for the assessment and were labeled accordingly, but maybe that wasn’t truly reflective of their reading ability. This could be one reason that some increased in the post-test.
Triangulation
Reading Level and Other Assessment Scores: 75% of students who were reading below grade-level also performed below grade-level on one or more word study test. After research, that same 75% showed an increase in both word study scores and reading level.
When looking at all data points, there are some connections and correlations that appeared. First, when looking at reading levels and the word study assessment scores, of the 15 students who were started below grade level, 10 performed at proficient- or below (0%-79%) in one or more other assessment (phonemic awareness, phonological awareness). This told me that students reading below grade level were more likely to perform below grade level expectations in word study as well. These 10 students were labeled “at-risk” due to their reading level being below grade level and scoring below grade level expectations on at least one other assessment.
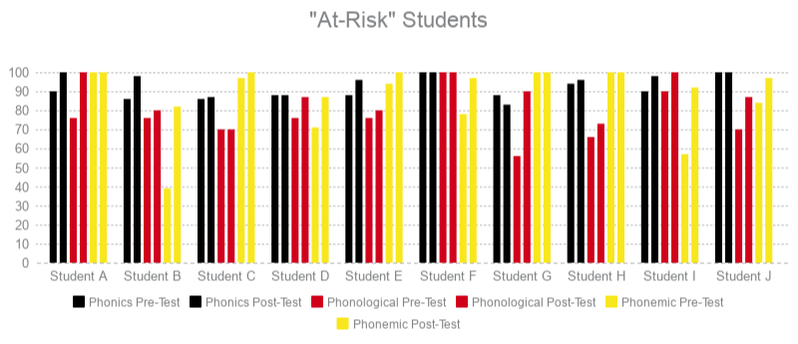
Figure 13: This graph shows "at-risk" students and their pre- and post-test word study scores. The left column of each color is the pre-test, and the right column of the same color is the post-test scores. All 10 of these students that were below grade-level on one or more assessment in the pre-test increased to be on grade-level in the post-test. Student G decrease on one test in the post-test, but was still on grade-level, and increased her phonological assessment that put her "at-risk."
All 10 students increased their phonological and/or phonemic assessment scores in the post-test and 9 of them increased significantly enough to receive a higher level on the grading scale, with at least proficient- in the post-tests. For example, one student went from beginning to advanced, one student went from progressing to proficient, etc. One student increased their score but remained at the proficient- level. Student G showed a decrease in phonics score in the post-test. However, the phonics score was not the assessment that put that student “at-risk” and the post-test score still is at the proficient level.
Of these 10, 8 of the students also increased their reading level as well as the assessment score(s). For example, Student A started reading at a level A and had a score of proficient- in the phonological and phonemic awareness tests. In the post-test, they increased to a level B, and both phonological and phonemic awareness tests increased. One student remained at the same reading level, but their proficient- scores increased to proficients on the post-test.
The data showed that my 10 “at-risk” students, as a group, increased from their start. All students increased their assessment score and 8 of them increased their reading level. This showed a connection between word study and reading achievement. Readers that were below-grade level tended to have lower word study scores. After research, there were increases in word study which in turn, increased students’ reading level and achievement. See Figure 13 above.
Reading Level and Phonological Awareness; Syllables Subsection: Pre-test data appeared to show a connection between syllables scores and reading level. However, post-test data was inconsistent with the apparent connection and disproved the original hypothesis that syllables impacted reading ability.
Data also revealed a pattern between syllables mastery and reading level in the pre-test. Prior to research, 15 students were reading below grade level. Of my below-level readers, only 3 students scored proficient or advanced on syllables. The other 12 scored either progressing or beginning (0%-66%), or in other words, 80% of my below grade-level readers performed low in the area of syllables. This was an interesting discovery that led me to question if syllables impacted reading more than expected.
However, in the post-test, 7 students were reading below grade level and only 2 students were still below the proficient expectation in syllables. Surprisingly, many students who had grown to be reading on-grade level or above actually decreased in the area of syllables. 9 students increased their reading level and scored a 66% or below on the syllables subsection.
This discrepancy in data showed that while syllables seemed to be related to reading ability in the pre-test, it did not correlate the same way in the post-test. Thus, I concluded that understanding syllables did not impact my students’ reading abilities.
Reading Level, Phonics, Phonemic Awareness, Phonological Awareness Assessments: When comparing all pre- and post-tests, there is growth among all assessments before and after research. These data points confirm the study’s effectiveness and show consistency across all assessments; both word study and reading achievement.
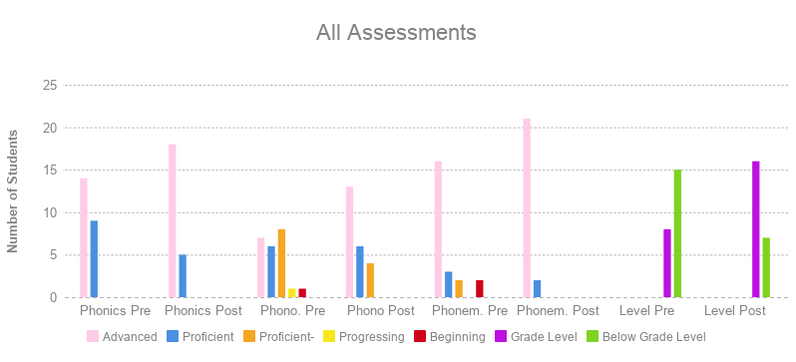
Figure 14: This graph includes all assessments: phonics, phonemic awareness, phonological awareness and reading level before and after research. This data confirms the study's effectiveness as scores increased in each assessment area.
The above graph shows the number of students and their scores on all assessments (phonics, phonemic awareness, phonological awareness, and Fountas and Pinnell reading level). Looking at the pre-test and post-test scores for all assessments, the amount of advanced scores increased, and the number of proficient-, progressing, and beginning scores decreased on all three word study assessments. The data showed that the activities implemented held a consistent influence on the understanding of the content and impacted all areas of word study as well as reading achievement.
Impact on Students
After looking at the data from all four data points (reading level, phonics test, phonemic test, and phonological awareness test) I saw significant growth in each assessment among the whole class. The number of students at proficient or advanced increased in each word study test, and the amount of readers on grade-level increased as well.
No test or assessment showed a decrease in scores as a whole; while some students did decrease in subsections here and there, the overall trend was positive. Growth in all areas confirmed that word study activities in guided reading increased overall reading achievement, and I can say that for my class, this study was successful. Overall, this study positively impacted my students. The activities that I implemented seemed to show an increase in engagement, confidence, interest, and overall excitement about reading. The data shows that the study was successful in improving word study skills and reading achievement.
The data provided has shown growth as a class in all pre- and post-tests. In addition to this quantitative data, I also saw many changes happen in the classroom. Prior to research, students were often reluctant to participate in guided reading groups, claiming they were “bored” and did not want to read or do word study activities. During research, I started to see a shift in attitude. Students were excited to come work with me, and excitedly asked me what they were going to be doing that day. They were more engaged with the word study activities, particularly those that included kinesthetic activities such as the clay, cubes, and body movement.
I also saw an increase in writing ability. Before research, while some of my students were writing sentences on their own, I noticed some students would write single words or need assistance to break up the words and write the sounds that they heard. During and after the research, I saw students try more on their own, write words based on the sounds, and write longer sentences than before.
I also saw an increase in engagement during reading time. During guided reading, students that are at the “read to self” or “read to someone” stations used to be full of chatter and play, rather than reading. After the implementation of my research, when I looked up from my table, I saw students engaged in books with peers or on their own. Students approached me and said, “I read this whole book by myself!” This study not only increased students’ scores, but transferred into their reading and writing throughout the day.
Lastly, the assessments themselves may have impacted the outcome of data in both the pre- and post-tests. For the phonics assessment, students were assessed on their knowledge of only lowercase letters, as opposed to uppercase or a combination of the two. Some students may have performed higher (or lower) if uppercase letters had been used. Also, if students had a hard time identifying lowercase letters, they most likely also had a hard time identifying the sounds for those same letters.
The phonological awareness assessment also may have influenced student scores. As mentioned previously, the syllables section only had 6 questions which meant students could easily move between advanced and proficient. The same went for the initial and final sounds sections on the phonemic awareness test, with only 5 questions each. While some sections (word awareness, segmenting, blending) had 10 or more possible points, other sections had a smaller amount. This may have caused a skew in data that may have been better represented if all sections had the exact same number of points possible.
Practices and Interventions
This study was conducted in my classroom for 7 weeks. The instructional strategies that were chosen were implemented during guided reading, which occurred first thing in the morning from 8:20-9:20 A.M. All instructional activities were implemented during small groups and assessments were all completed individually.
Assessments were chosen to be conducted individually in order to record accurate data for each student. I wanted my students to try their best and provide the answers that they thought were correct, as opposed to the answers that their peers provided.
There are some adjustments that need to be noted as a result of snow days. With an excessive amount of snow days during the course of the study, some groups lost opportunities to experience all activities that were planned for them. A total of four snow days occurred during the 7 weeks of research, resulting in three guided reading groups missing a total of four days of activities. The planned 32 days of instruction turned into 28 days. Groups 1 and 2 were planned to be seen a total of 32 times and this reduced to 28 times. Group 3 was planned to be seen 18 times and this reduced to 14 times. Group 4 was planned to be seen 14 times and was seen all 14 times that were scheduled.
As the teacher, I think I did a good job of maintaining the schedule as best as I could and adjusting when snow days occurred. Each day had word study activities already planned that I was able to stick to and implement. However, there were a few times throughout the study that word study did not happen due to time constraints. Based on the reading level of my students I had groups from 6-8 students in size. Larger groups took more time to read texts, answer questions, and complete other activities. Due to this, some of the comprehension activities in guided reading took longer than expected and word study was missed. But, overall, the majority of scheduled word study activities took place.
Questions
After looking at the data, questions arose that I have speculated about. First, why did students miss the letters Q, U, E, and Y the most on the phonics test? When the pre-tests were first given, I saw that these were the most common. It was interesting to see they were also the most commonly missed answers on the post-test as well. Why is that? After considering the letters, I realized that the letter Q is far less common in kindergarten texts. The letter Q is also not present in any kindergarten sight words. /Q/ is also a sound that is more complex, as it consists of two sounds blended together to make the /kwa/ sound, since we teach that Q makes the sound as if the U were attached (qu).
The letter U was the letter that was missed the most on pre- and post-tests. I speculate the reason for this is also due to the fact that my students often mix up the /u/ sound with /o/ and /y/. /E/ was often confused with /i/. I noted that many of my students struggled with letters U, E, and Y specifically due to the similarities to other letter-sounds. As stated in my analysis, students needed more practice and exposure to Q, U, E, and Y sounds and words that include those sounds.
Lastly, why was the syllables subsection the lowest performing area on both pre- and post-tests? Some students performed poorly on syllables, but scored advanced on higher level skills such as blending and segmenting. After reflecting on the assessments and my instruction, a few thoughts come to mind as to why this might be. First, the syllables section came with three possible practice problems for students. When giving this assessment, I chose one of the practice problems to give students, being the word “elephant” which has three syllables. Since the practice problem was a multisyllabic word, students were able to identify the two and three syllable words more easily. Had the practice problem been the monosyllabic word, or had I used all three practice problems, perhaps the students would have scored better and the amount of monosyllabic words missed would have decreased.
